The U.S. Census Bureau releases data on poverty every year. We pay close attention to this data at the Foundation, and to what new findings tell us about how kids are faring in New Hampshire. We are working, through our New Hampshire Tomorrow initiative, to increase opportunity for New Hampshire’s kids, particularly those from low-income families. So this is relevant data for us to track and understand. But before we get into the data, it’s important to understand what “in poverty” and “low income” even mean. How is poverty defined? The short answer is: it’s more complicated than you might think.
So what is the “poverty line” anyway?
A family of four with an income of $24,300 or less falls below the federal poverty line (sometimes also referred to, somewhat obliquely, as “100 percent of poverty”). This figure is adjusted for different family sizes. In New Hampshire, where the cost of living is high, $24,300 per year for a family of four is very little. (The median rent for a two-bedroom apartment with utilities in New Hampshire was $1,206 per month in 2016 – and significantly higher in some areas. Even paying the median rent, a family of four would have just $9,828 left for the year to cover everything else: food, health care, child care, transportation, etc.)
What does “low-income” mean?
Even if your family is making well above the federal poverty line, you are obviously still struggling. Which is why we often talk instead about “low-income” populations – sometimes referred to as “200 percent of poverty,” or about $44,600 for a family of four.
Is free and reduced-price school lunch eligibility the same as the poverty line?
No. But it’s another number that helps us understand the childhood poverty picture in New Hampshire.
For children to be eligible for free or reduced-price lunch through the National School Lunch Program, their family must be at 185 percent of the federal poverty level or lower ($44,000 per year for a family of four). For a small state like ours, the free and reduced lunch number can provide a more accurate picture of child poverty than the census data, because it represents a count of actual children. Children on free and reduced-price lunch programs are tallied in each district and reported in aggregate. The U.S. Census poverty data, by comparison, is based on an estimate. It’s like trying to figure out how many blue marbles are in a jar full of marbles. The Census makes its best guess. But counting kids on free and reduced lunch is like counting each blue marble in the jar.
(As with any data point, free and reduced lunch numbers are also not perfect. Some children are enrolled automatically, because their families already qualify for other assistance programs. But families whose kids are not enrolled automatically have to submit an application, and some do not enroll their children even though they are eligible. And not all children who are enrolled use their free or reduced-price lunch benefits due to the stigma associated with being perceived as low-income.)
Still with me? Great. Now, here’s the data:
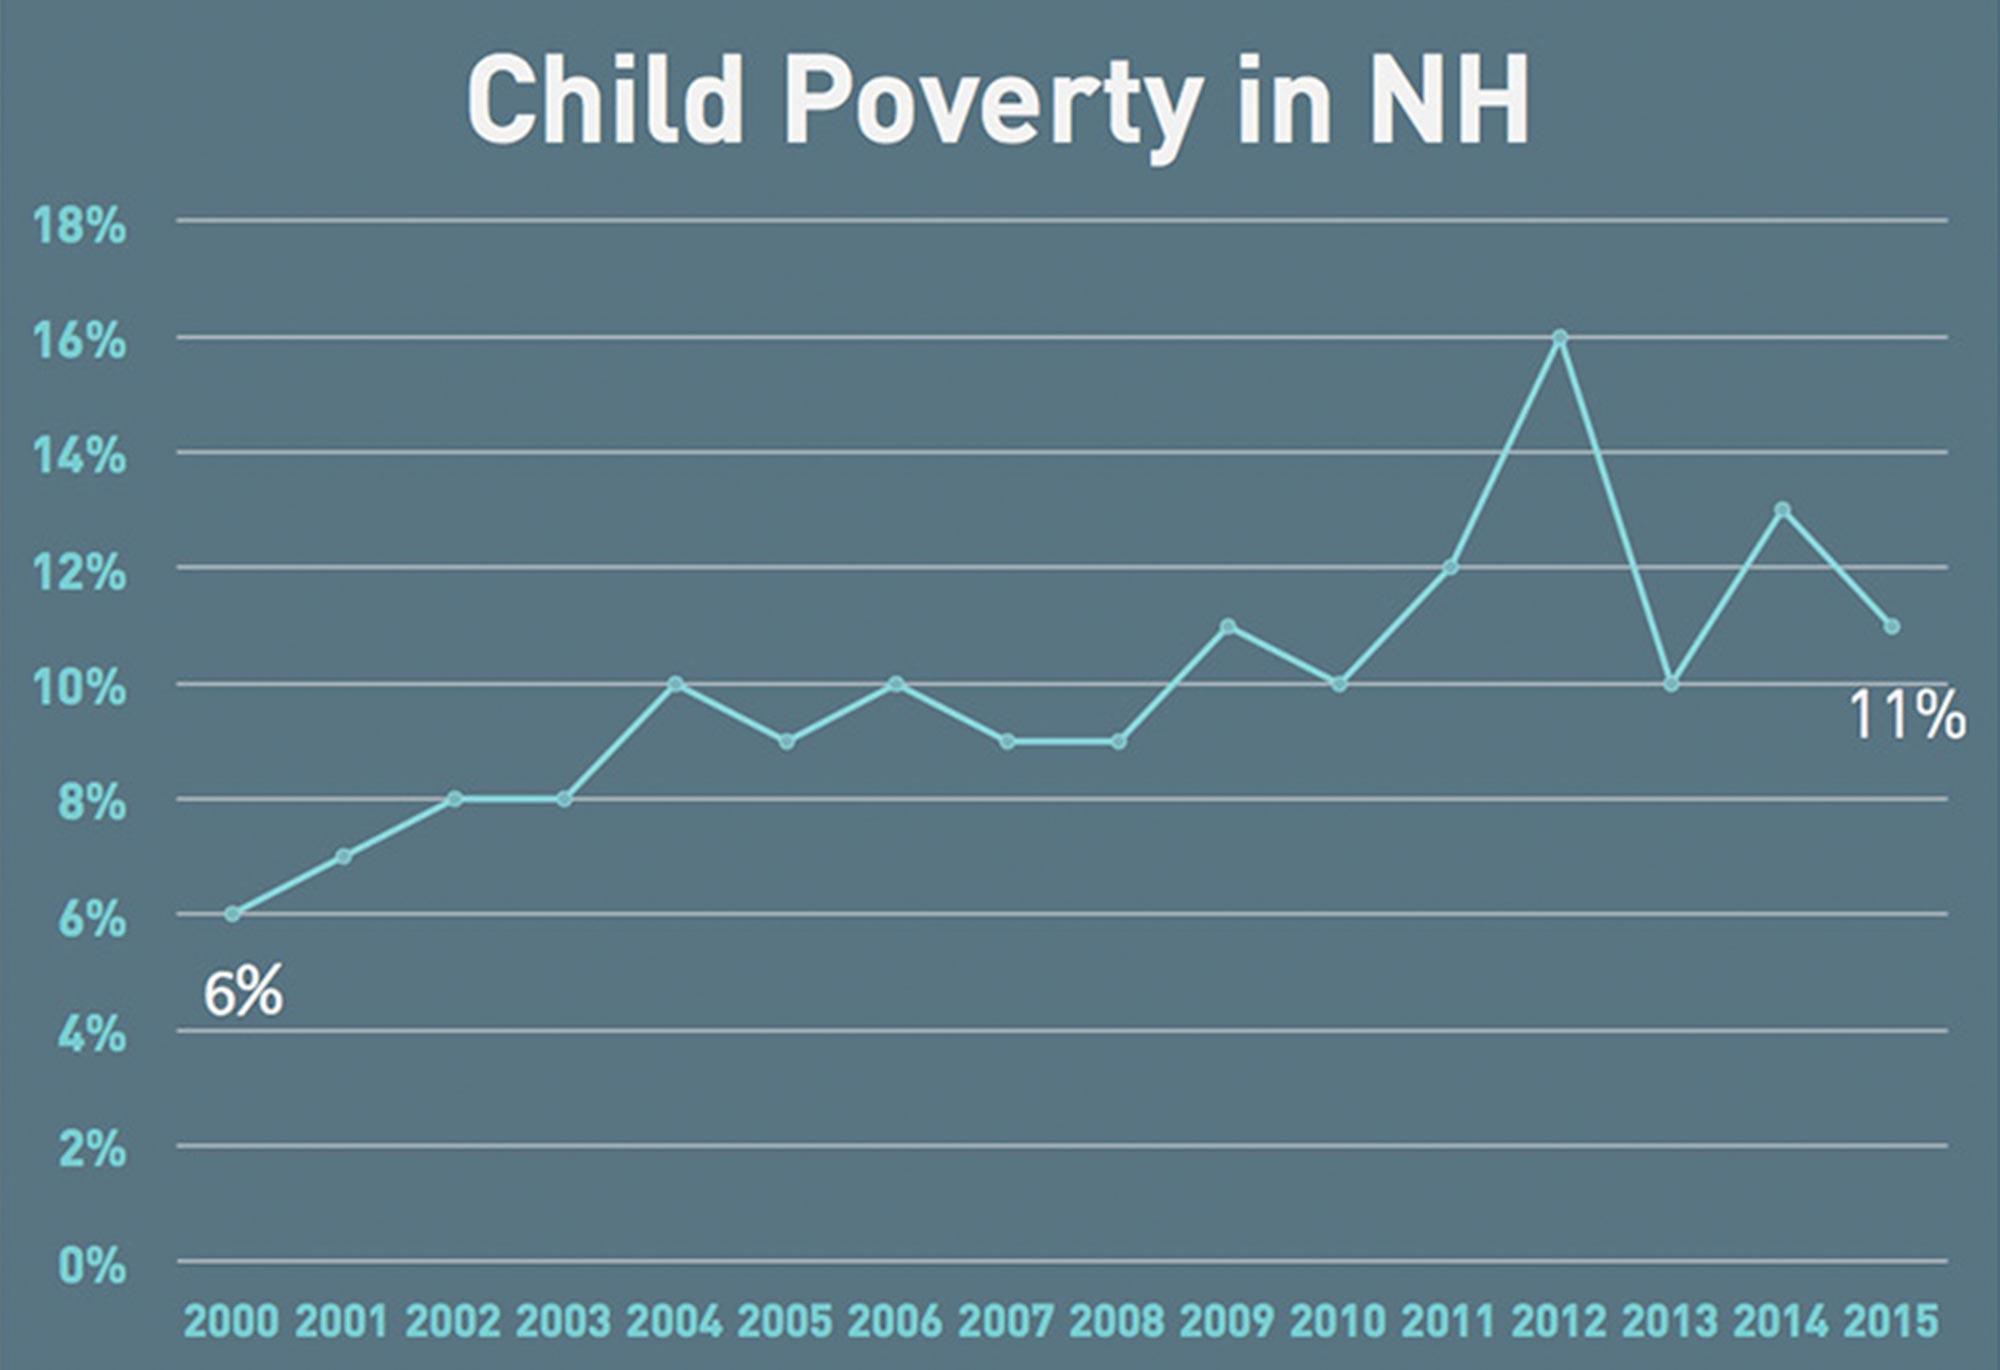
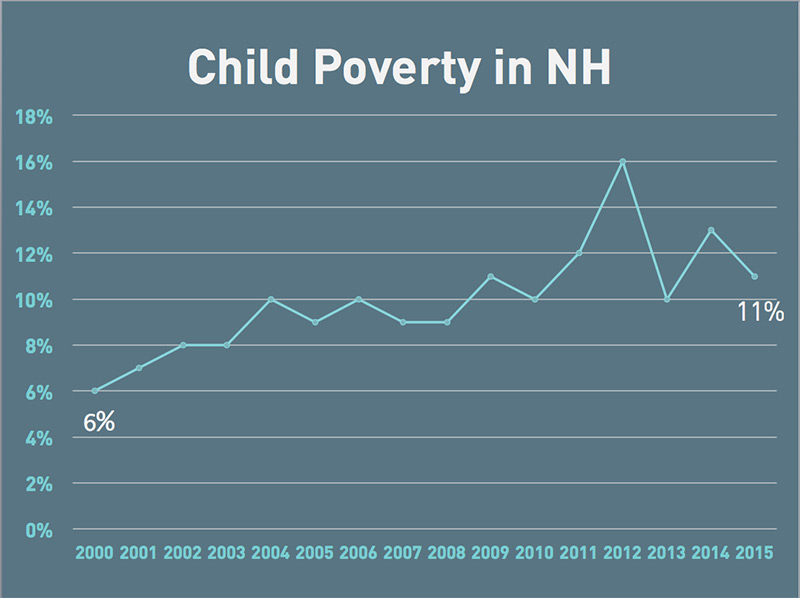
One in ten New Hampshire kids live in poverty.
In 2015, about 11 percent of New Hampshire kids fell below the poverty line. That means that 11 percent of New Hampshire’s kids live in families with incomes of less than $24,300 per year (for a family of four). That’s about 28,000 kids – or the entire combined populations of Portsmouth and Plymouth. Adult and child poverty remain very low in New Hampshire – in fact, the lowest in the country. But (and this is a meaningful “but”): since the turn of the century, the trend for New Hampshire has gone in the wrong direction. This is a real concern. While New Hampshire has the lowest child poverty rate in the country, we know that the rate of child poverty in New Hampshire has been on the rise. As Foundation president Dick Ober often reminds us, New Hampshire’s child poverty rate has almost doubled since the turn of the century.
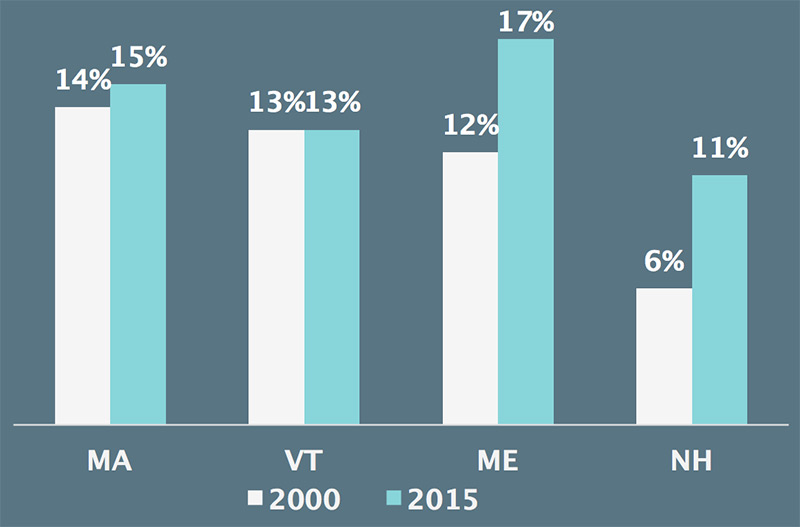
Another concerning trend is how New Hampshire is doing compared with our neighbors in New England. If we look at the rise of child poverty between 2000 and 2015 in New Hampshire and among our Northeast neighbors, it’s clear that New Hampshire had the lowest rate, and continues to have the lowest rate. But the net change between those two years for New Hampshire exceeds that of some of our neighbors. So while New Hampshire has low childhood poverty, the increase has been significant – jumping into double digits.
One in four New Hampshire kids qualify for free and reduced-price lunch.
The free and reduced lunch figures have risen as well. In 2015, 28 percent of New Hampshire’s kids qualified for free or reduced-priced lunch. That’s 48,000 kids, or one in four. In 2000, only 15 percent of New Hampshire’s students qualified. The rise in free and reduced lunch eligibility is in line with the rise in child poverty.
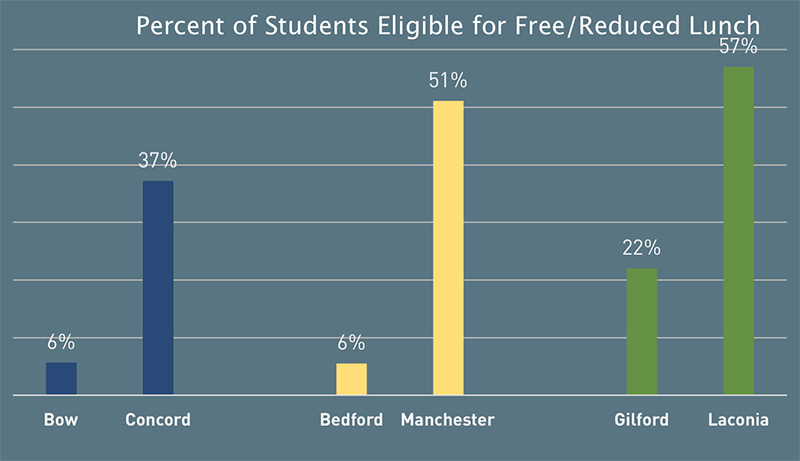
Unlike child poverty data, free and reduced lunch data are available on a local level – which helps us understand child poverty on a town-by-town level. The local numbers reveal some great disparities in New Hampshire that are often hidden by statewide data points. Look at the three pairs of bordering school districts represented in the chart below: Bedford and Manchester, Gilford and Laconia, Concord and Bow. These bordering communities have very different student income levels. In Manchester, 51 percent of kids qualify for free or reduced-price lunch. In neighboring Bedford, just 6 percent do. In some cases the creation of new districts in affluent communities has intensified disparities, segregating students from those communities from their less-affluent peers.
What these data show us is that, while overall child poverty remains low in New Hampshire, there are pervasive (and deepening) pockets of poverty where kids do not have the same opportunities available to their more wealthy peers.
At the Foundation, we believe that all of our kids deserve the opportunity to thrive. As we work to increase opportunities for New Hampshire’s kids, we will continue to track (and explain!) these data and use them to inform grantmaking and strategic initiatives.
Related Stories

Bringing it Home
The Monadnock Economic Development Corporation is working to increase child care availability in the region through the “Bringing it Home” program, which is supporting in-home child care providers.
An evolution
An integrated response to mental health and substance use disorders is key to promoting health and well-being — and to saving lives. As the science in the field has evolved, so has our work.
From chaos to thriving
CASA volunteers bring stability and consistency to children who need it most. Judges refer a child to CASA when the state opens a child protection case. A volunteer CASA advocate is a child’s representative through court proceedings, developing a trusting relationship and offering extensive information to help judges decide what is best for the child.