


While driving down from Isle La Motte in early December, my son and I noticed a fine skim of ice floating down the Alburg Passage. As it collided with the Route 2 bridge supports, it broke into rectangular fragments. I wondered if what I was seeing was typical, or a symptom of changing climate? But a single observation tells you only about the current weather, and says nothing about climate trends.
To understand long-term patterns requires long-term data. So I reviewed ice formation data on Lake Champlain. I learned that between 1816 and 1916, the lake was “closed” to navigation in 96 of 100 winters. In the last 30 winters, the lake has closed 13 times, and just three times this past decade. At first blush, this might seem like overwhelming evidence for less ice, but again, this is not the whole story.
The 200-year data set was gathered by three different governmental agencies, a Burlington public official and historian, and a “cooperative weather observer.” Consistency might be a bit much to expect and “closed to navigation” could range from an ice passage from Burlington to Plattsburgh, or simply frozen harbors.
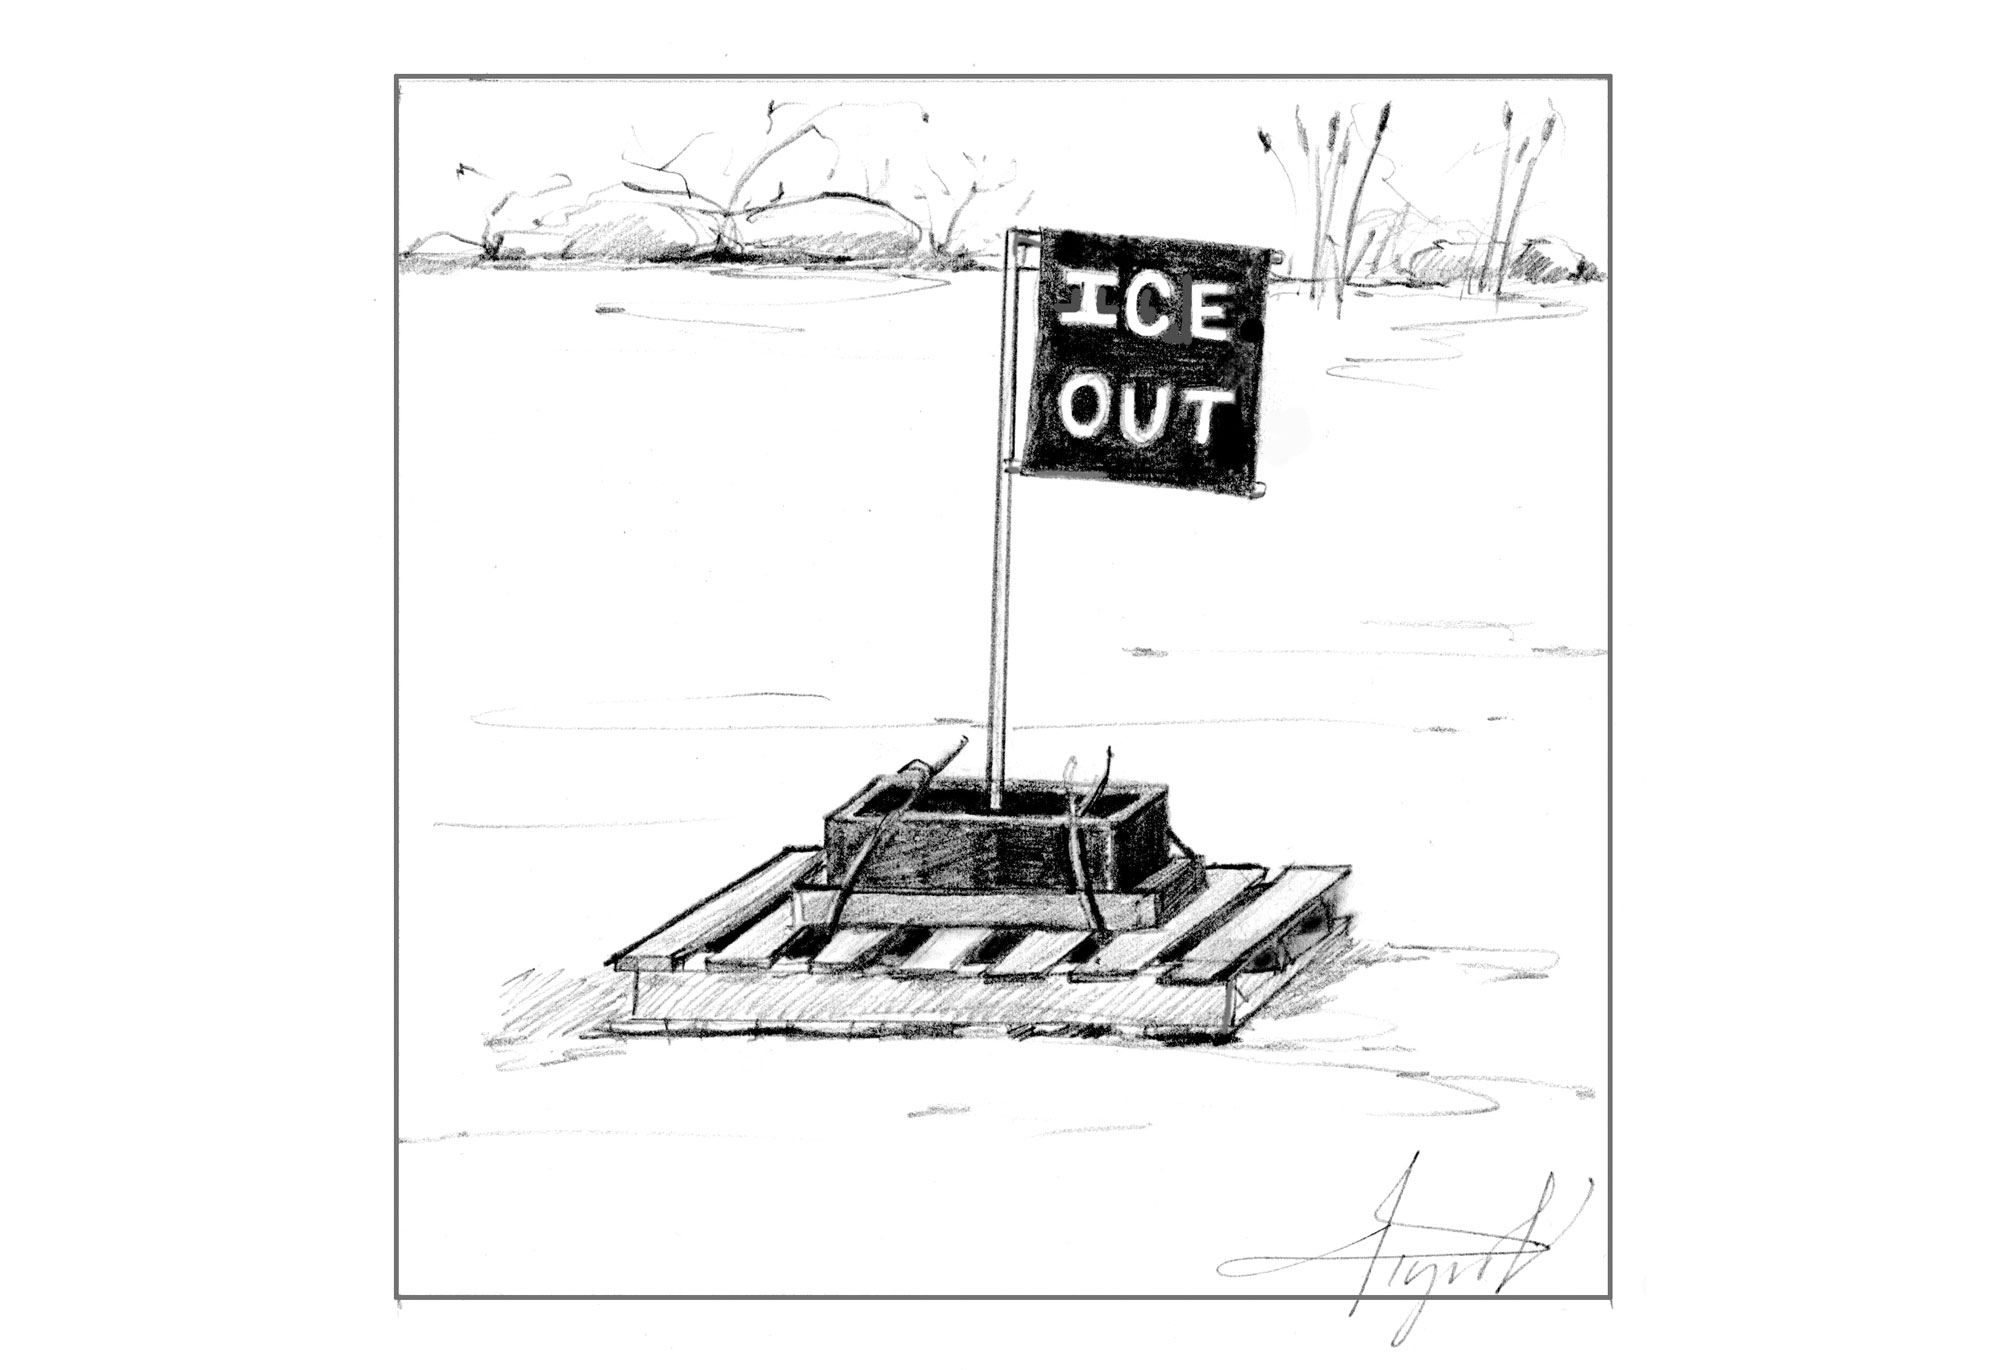
For a more consistently measured data set, Dr. Alan Betts, a Vermont climatologist, looked to the Joe’s Pond Association. Each winter for more than two decades, association members have placed a wooden pallet on the ice of Joe’s Pond in West Danville, Vermont. A cinderblock sits on the pallet and is strung to the plug of an electric clock on Homer Fitts’ deck. For a small donation to the association, you too can guess when the ice will give way, the cinderblock sink, and the clock get unplugged; best guess wins!
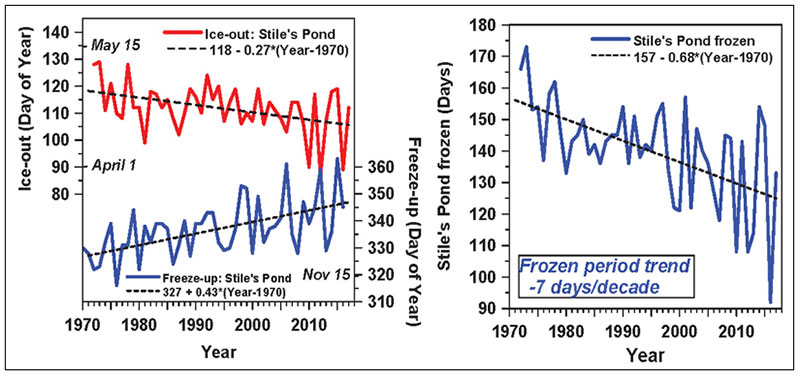
Stiles Pond Ice-Out Dates and Frozen Days, Updated to Spring 2017, courtesy of Dr. Alan Betts
The simplicity and consistency of this measurement technique is precisely what piqued Betts’ interest. Across the short interval of 20 years, there’s a clear trend; the cinderblock sinks about six days earlier than it did two decades ago.
Betts has also reviewed 40 years of ice-out data from the Fairbanks Museum and found the same pattern: the ice on Stiles Pond goes out about three days earlier per decade. Every decade, on average, the pond has frozen four days later, and the total frozen period has been shrinking by seven days per decade since 1970.
“Ice out” patterns are consistent with other indicators of change. For example, Betts has reviewed data on Vermont’s lilac flowering dates. On average, lilac leaves are developing about two weeks earlier than they did in the 1960s, and flowers open more than a week earlier.
With the greatest respect to ice and lilac, I suspect that some Vermonters might be more interested in changes in maple sugaring; this thought has not been wasted on Vermont scientists. Justin Guilbert and Vermont EPSCoR collaborators examined climate trends and predicted 11 fewer maple sugaring days by mid-century. They also predicted a shift in the sugaring season towards the midwinter months of December and January.
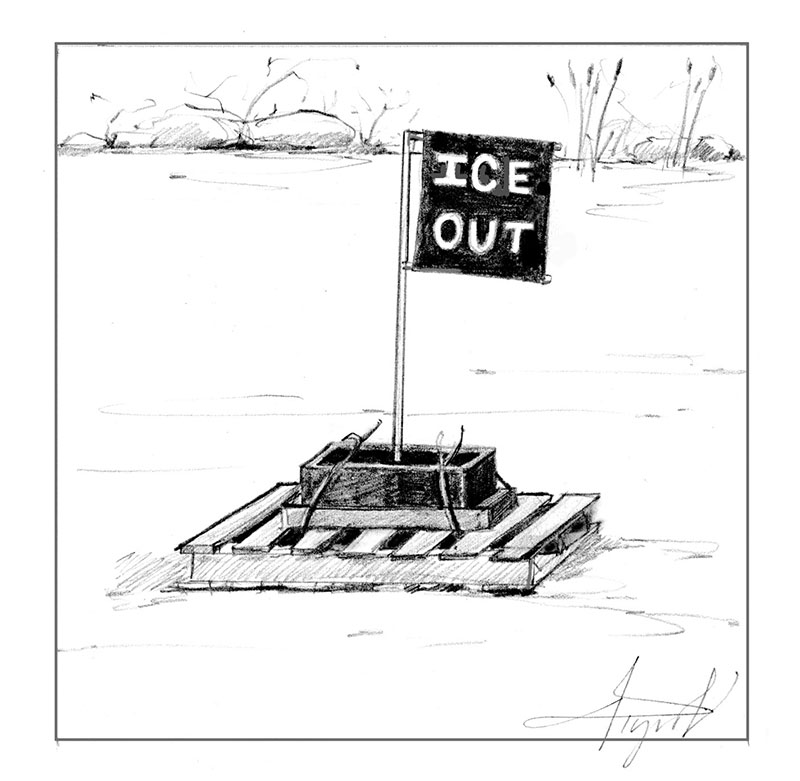
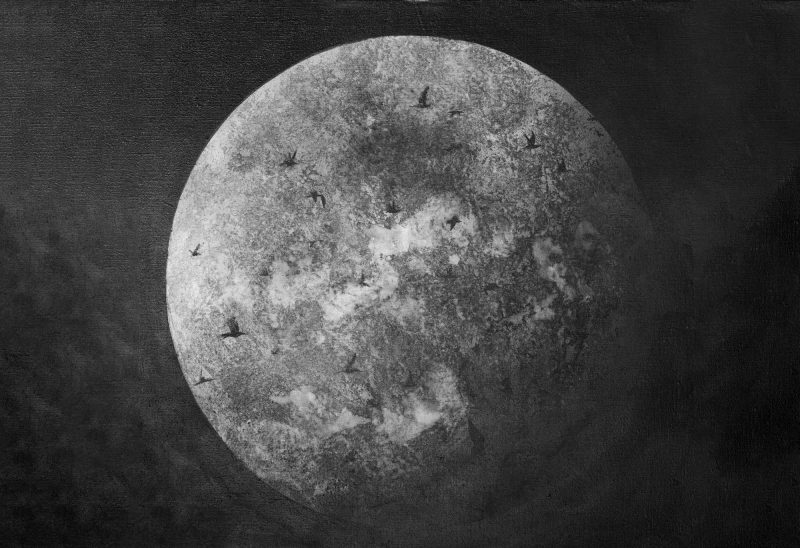
Ice Out. Illustration by Adelaide Tyrol.
If at this point, you’re thinking that these trends are awfully short-term, and that anyone trying to predict the future of sugaring is walking on thin ice, you have a valid point; one of the difficulties of predicting climate change and its effects is the complexity of factors, including the background “noise” of our naturally variable weather conditions. This is, after all, a region which prides itself on the notion that, “if you don’t like the weather, wait a few minutes.”
That said, while we can’t with certainty predict what maple trees, or ponds, or ornamental plants will do in future years, it’s very clear that we’re in a period of rapid temperature change, and based on what we know of atmospheric science and human-caused emissions, there’s no reason to expect that change to stop any time soon.
As Betts recently told me, “climate change is on a roll and all we can do is slow it down, and give our societies and all of life on Earth more time to adapt.” In the meantime, I plan on placing my first ever bet on Joe’s Pond this year. What day I will bet on? That’s my secret; but it will certainly be earlier than I would have bet two decades ago.
Declan McCabe teaches biology at Saint Michael’s College. His work with student researchers on insect communities in the Champlain Basin is funded by the National Science Foundation. The illustration was drawn by Adelaide Tyrol. “The Outside Story” is assigned and edited by Northern Woodlands magazine, and sponsored by the Wellborn Ecology Fund of the New Hampshire Charitable Foundation, a fund dedicated to increasing environmental and ecological science knowledge: jryyobea@aups.bet. A book compilation of Outside Story articles is available at http://www.northernwoodlands.org.
Related Stories
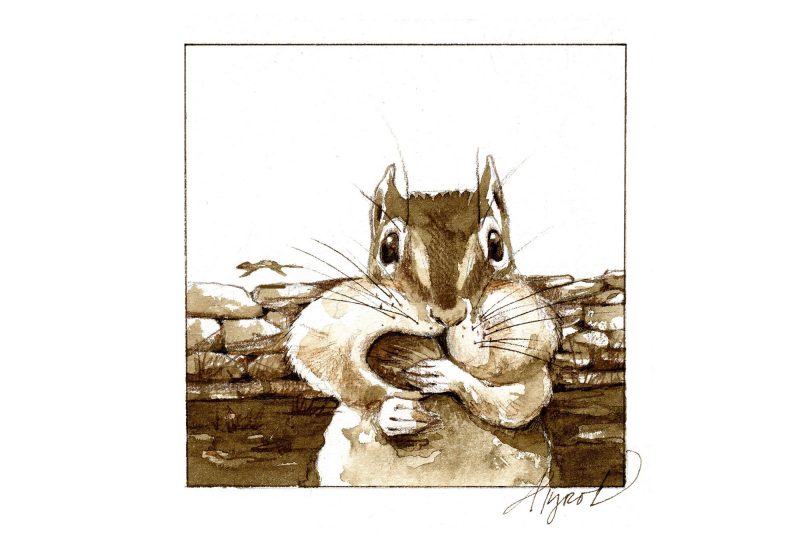
Chipmunk Game Theory 101
The latest installment of "The Outside Story," sponsored by the Wellborn Ecology Fund of the New Hampshire Charitable Foundation, explains how eastern chipmunks have evolved to be energy maximizers, seeking to strike the optimal balance between energy gain per cheek-pouch load of food and number of trips back to the burrow.
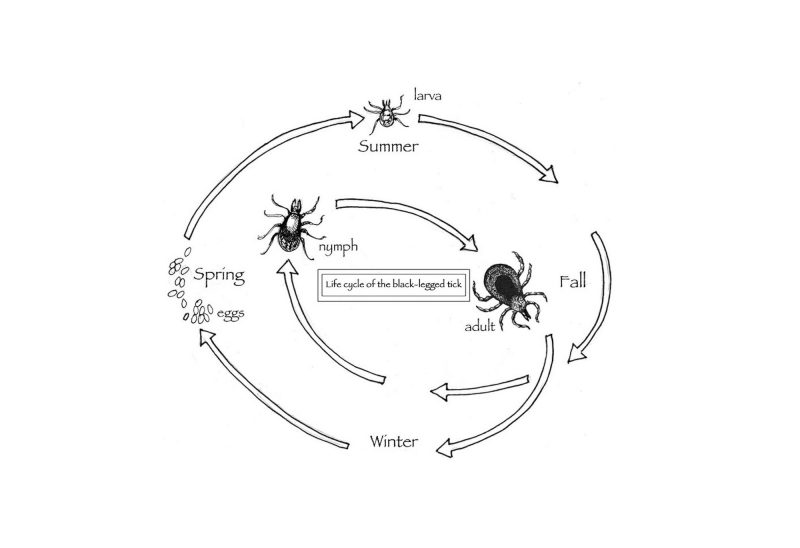
Tick-borne diseases on the rise
In the latest installment of "The Outside Story," sponsored by the Wellborn Ecology Fund: Ticks are more abundant than ever before in northern New England, and tick-borne diseases are on the rise. Read more about why, and how to stay safe while still enjoying time outside this summer
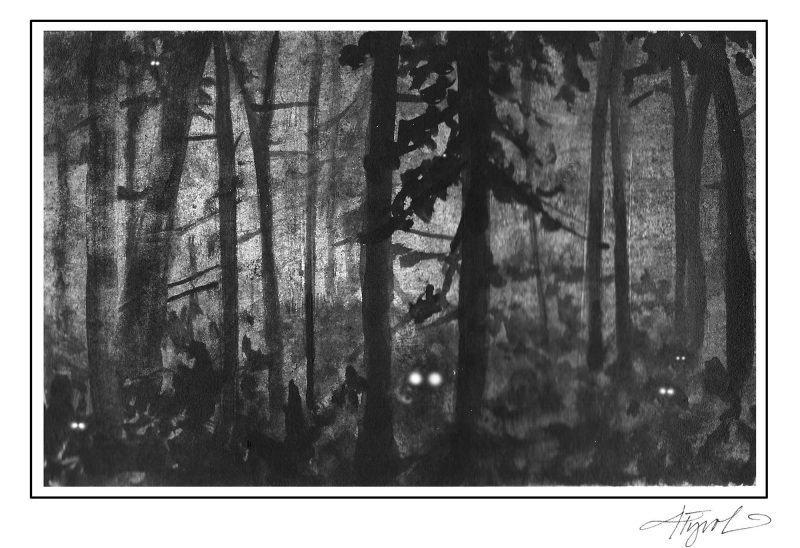
Why animals’ eyes shine at night (but people’s don’t)
In the latest installment of "The Outside Story," sponsored by the Wellborn Ecology Fund, learn about eyeshine in animals, which is produced by a membrane called the tapetum lucidum (“tapestry of light”), a reflective surface located behind the retina